Research Presentations
Slides produced as visual accompaniment for Professor Rod Connolly’s 2022 presentations to postdoctoral researchers at academic conferences.
Visual overview of automated intelligence and computer vision use in remote sea-life monitoring (adapted from paper by Lopez-Marcano et al. 2019), for use in opening keynote speech to the Australian Society for Fish Biology 2022.
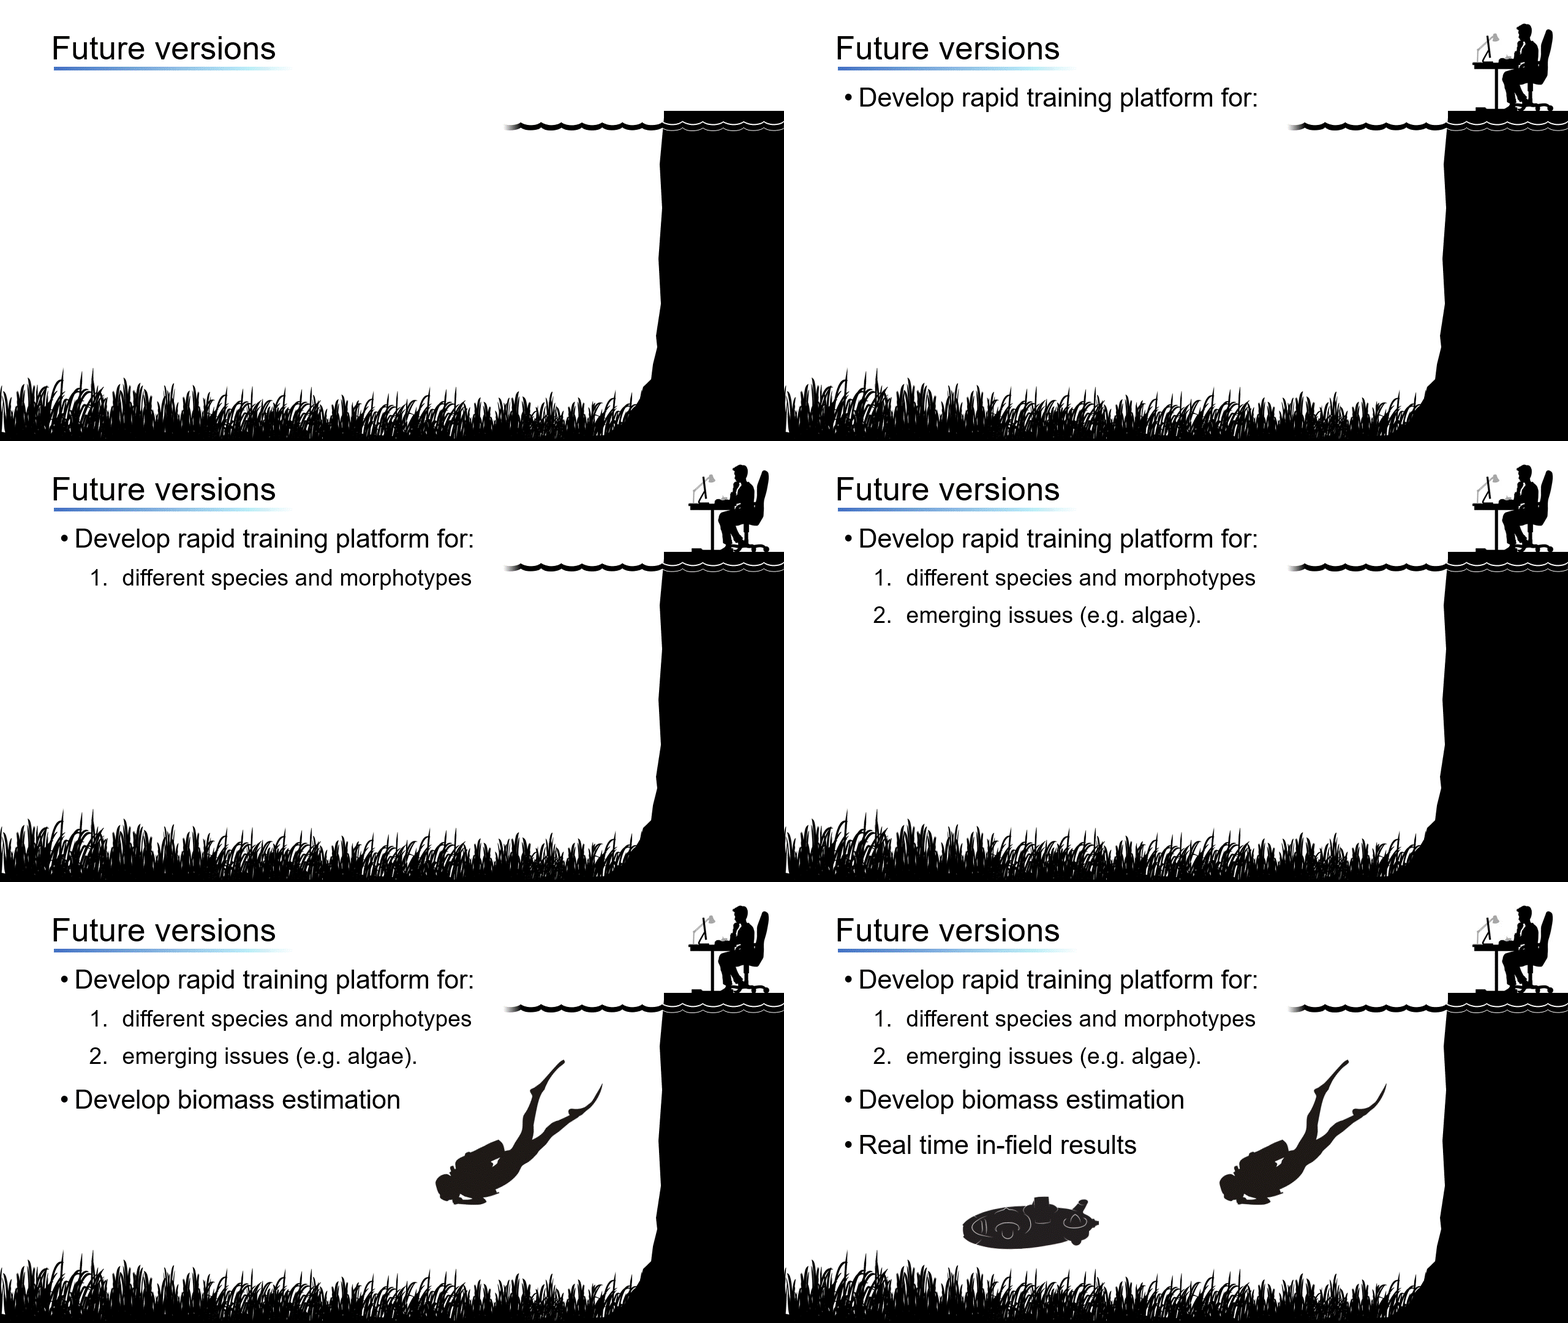
Animated overview of future plans for Upscaling seagrass monitoring using underwater drones and automated image processing, presented at the World Seagrass Conference & International Seagrass Biology Workshop August 2022.
Educational Content
The following diagrams were produced as free study aids for students studying glucose metabolism, respiratory processes and energy generation as part of an undergraduate Metabolism course towards several bachelor’s programs. Students reported that these diagrams assisted their comprehension of complex course material.
Glycolysis is the metabolic process that serves as the foundation for both aerobic and anaerobic cellular respiration. This diagram details the chemical reactions and changes to molecular structure as Glucose undergoes Glycolysis to yield Pyruvate and the energy-storing compound Adenosine Triphosphate (ATP). The reverse process of Glucose production from Pyruvate (known as Gluconeogenesis) is also shown.
Glucose is the primary sugar molecule metabolised by the Glycolysis process. This diagram summarises how other common sugar and starch molecules are digested by enzymes for metabolism into energy via Glycolysis.
Pyruvate is the primary output of Glycolysis. This diagram summarises the Cori Cycle: a process by which lactic acid produced from pyruvate metabolism during anaerobic conditions (e.g. exercise) is transported from the muscles to the liver, where it is converted back to glucose for use in new respiratory cycles.
The Tricarboxylic Acid (TCA) cycle is the main source of energy for cells and an important part of aerobic respiration. This diagram provides a detailed overview of chemical reactions and changes to molecular structure as Acetyl Coenzyme A (Acetyl CoA) passes through the cycle to yield energy potential in the form of oxidised Nicotinamide Adenine Dinucleotide (NADH) and Flavin Adenine Dinucleotide (FADH2). Colour coding of carbon atoms assists students in following the progress of reactions.
The Electron Transport Chain (ETC) and Oxidative Phosphorylation is the end-process of aerobic respiration in mammals, and drives generation of the majority of a cell’s energy-containing Adenosine Triphosphate (ATP) molecules. This diagram summaries the movement of electrons and hydrogen ions (protons, H+) via the chain to create a proton-gradient charge differential that powers transport of Inorganic Phosphate (Pi) and Adenosine Diphosphate (ADP) across the membrane and into the mitochondria for Oxidative Phosphorylation into ATP via the gradient-powered F1F0ATPase enzyme.
Electrons are supplied by Nicotinamide Adenine Dinucleotide (NAD) and Flavin Adenine Dinucleotide (FADH2), produced by the TCA cycle and other respiratory processes. These carriers are oxidised by NADH Dehydrogenase (Complex I) and Succinate Dehydrogenase (Complex II) to yield electrons, which pass through an electron transport chain comprised of Ubiquinone (Complex Q), Cytochrome Reductase (Complex III), Cytochrome c (Cyt c) and Cytochrome Oxidase (Complex IV), driving transport of hydrogen ions (protons, H+) into the intermembrane space of the mitochondria.


